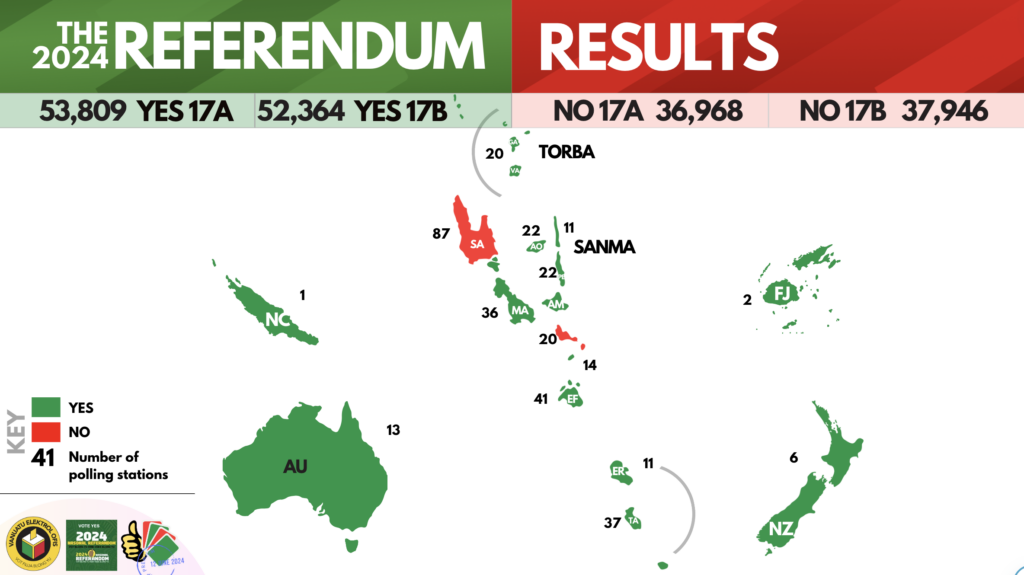
The map uses green and red shading to represent the outcomes of the 2024 National Referendum in Vanuatu, with each color corresponding to the majority vote in each area:
Green Shaded Areas: These regions have a majority of Yes votes for the referendum questions. The green areas highlight where the population predominantly supported the referendums.
Red Shaded Areas: These regions have a majority of No votes for the referendum questions. The red areas indicate where the population predominantly opposed the referendums.
Numbers on the Map: The numbers within each shaded area represent the number of polling stations in that specific region. This provides additional context to the vote distribution, indicating how many polling stations contributed to the result in each area.
We can also visualize the areas of attention in the 2024 National Referendum results, highlighted by the distribution of green and red shading can be understood as follows:
Regions with High Support (Green Areas)
Efate and Port Vila (Shefa Province): These areas show strong support for the referendum questions, indicated by the large number of green-shaded polling stations. Given their high population density and number of polling stations, these regions significantly influence the overall referendum outcome.
Tanna (Tafea Province): This area also shows considerable support for the referendum questions, which is critical as it reflects the political leanings of one of Vanuatu’s more populous islands.
Regions with High Opposition (Red Areas)
Santo (Sanma Province): This area is predominantly shaded in red, indicating a strong opposition to the referendum questions. Santo’s opposition is crucial due to its significant population and number of polling stations, which can substantially impact the overall results.
Epi (Shefa Province): Epi also shows strong opposition, which is notable given its smaller size but clear stance against the referendum questions.
Balanced or Mixed Regions
Pentecost (Penama Province) and Malekula (Malampa Province): These areas might have mixed or lighter shades, reflecting a more balanced outcome between Yes and No votes. The close results in these areas highlight regions with divided opinions, which can be critical in understanding the nuanced public sentiment and potential areas for further political engagement or clarification.
Overseas Votes:
Australia, New Zealand, Fiji, and New Caledonia: These areas show the voting patterns of Vanuatu citizens living abroad. While their numbers might be smaller, their voting trends (as indicated by the shading) provide insight into the diaspora’s perspective on national issues, which is vital for a comprehensive understanding of the overall voter sentiment.
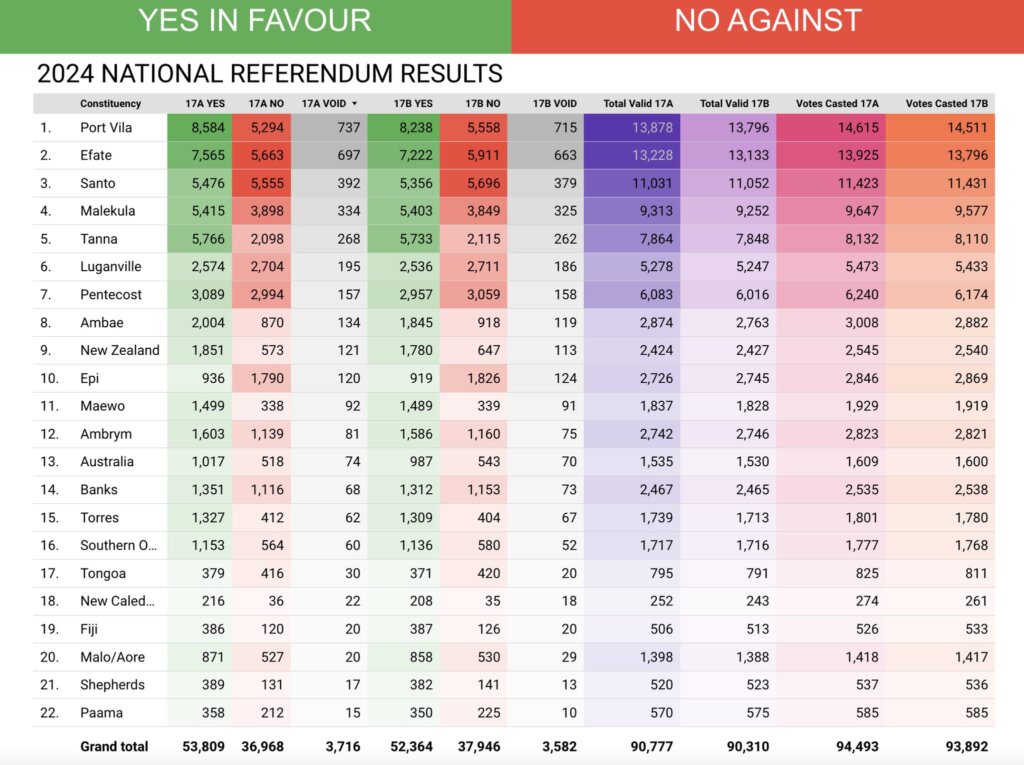
The information here presents the results of the 2024 National Referendum in Vanuatu, detailing the votes for two referendum questions (17A and 17B) across various constituencies and provinces. Each row includes the number of Yes, No, and void votes for both 17A and 17B, along with the total valid votes and the total votes casted for each question. The results are broken down by constituency within each province, as well as for overseas voters in Australia, New Zealand, Fiji, and New Caledonia.
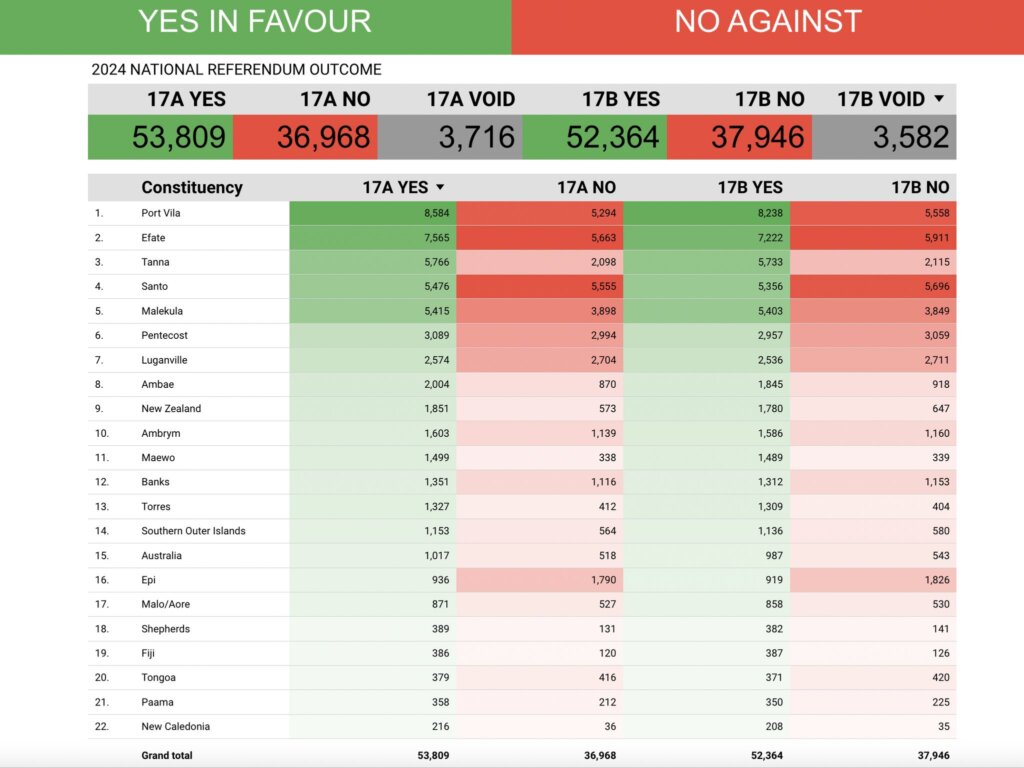
The 2024 National Referendum in Vanuatu showed diverse regional voting patterns. Key areas of strong support included Efate and Port Vila in Shefa Province, as well as Tanna in Tafea Province, with significant Yes votes. Conversely, regions such as Santo in Sanma Province and Epi in Shefa Province demonstrated notable opposition with majority No votes. Mixed results were observed in places like Pentecost and Malekula. Overseas votes from Australia, New Zealand, Fiji, and New Caledonia also contributed, generally leaning towards support for the referendum questions.
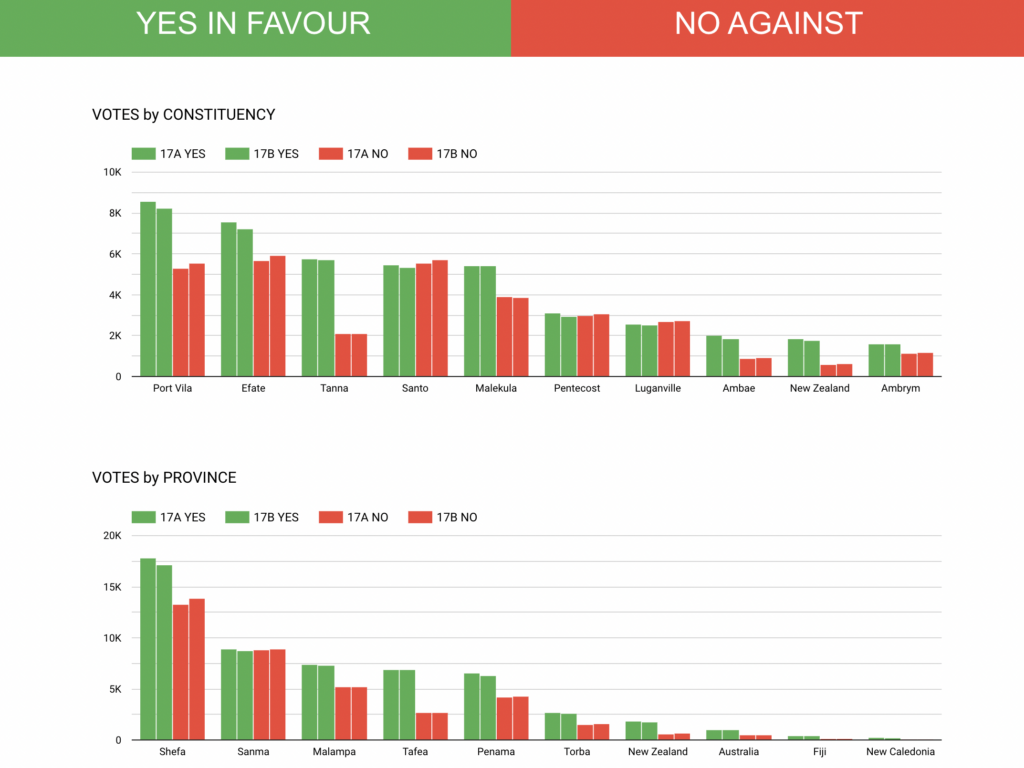
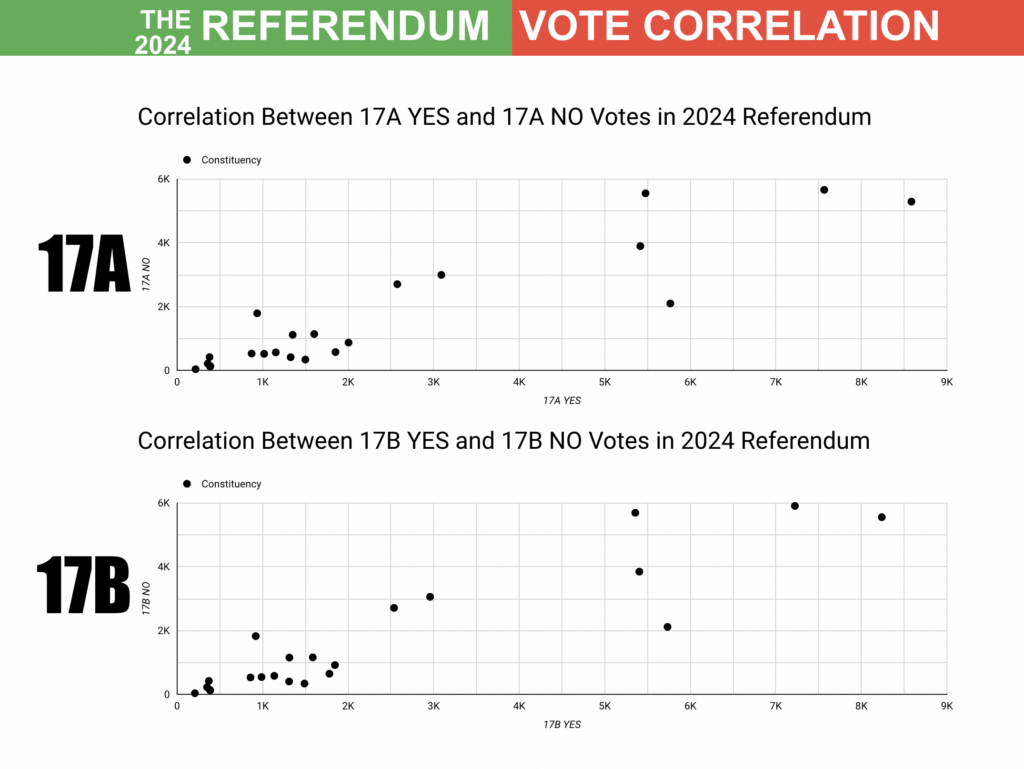
The scatter plot visualizes the relationship between YES and NO votes for each constituency. Each data point represents a constituency, positioned based on its YES votes (X-axis) and NO votes (Y-axis). This graph helps identify patterns, such as whether constituencies with high YES votes also have high NO votes, or if there is significant variability, and it aids in understanding overall voting trends and regional differences in the referendum results.
